JOB DATA SENT A WARNING- AND THE FED IS LISTENING


Weekly Market Recap: A Jobs Report That Changes the Game
This past week wasn’t short on drama in the economic world. The Commissioner of the Bureau of Labor Statistics was abruptly fired — right after the release of a jobs report that came with a stunning 258,000-job downward revision for May and June, and a weaker-than-expected July gain of just 73,000.
Politics aside, the implications are big. The Fed has made it clear: no rate cuts until inflation is firmly under control or the labor market shows real signs of weakness. Now, with hiring slowing and wage growth cooling, the odds of a September cut have jumped to over 80%.
Here’s what stood out — and why it matters for real estate:
Fed Meeting: Steady for Now, but Cracks Are Showing
Rates stayed unchanged for the fifth straight meeting.
For the first time in 30+ years, two Fed governors dissented — calling for a cut now.
The Fed’s next move hinges on whether inflation keeps trending down and whether job market softness continues.
July Jobs Report: The Headline Isn’t the Full Story
Just 73,000 jobs added in July vs. 110,000 expected.
May & June revised down by 258,000 jobs — a massive adjustment.
The Household Survey showed 260,000 jobs lost last month, including 440,000 full-time positions.
Unemployment ticked up to 4.2%, while wages grew at 3.9% year-over-year.
These revisions often appear at economic turning points — the last time we saw something this sharp was during the 2008–2009 recession.
Manufacturing: Five Months in the Red
ISM Manufacturing PMI dropped to 48.0 — the lowest since late 2024.
Fifth straight month of contraction, 31 declines in the last 33 months.
New orders are shrinking, and 25% of manufacturers cut jobs in July — the highest share since 2020.
A manufacturing slowdown has historically been a warning sign for the broader economy.
Why This Matters for Buyers and Agents
Slowing job growth and weak manufacturing data make a September rate cut more likely.
Lower rates could improve affordability, unlock stalled inventory, and bring hesitant buyers back into the market.
Timing and strategy will be critical — the best opportunities may open as rates shift.
If September brings the largest jobs data revisions since 2009 — as some economists predict — mortgage rates could see meaningful relief before year-end. The key takeaway? The market is at an inflection point, and the smartest players are preparing now, not waiting for the headlines to catch up.

August isn’t easing us in—it’s coming out swinging with a full lineup of market-moving events that could shift the conversation on mortgage rates in real time. Here’s where the spotlight is this week:
S&P Global Services PMI (July) – Already in the Books
July’s reading came in at 55.2, a big leap from June’s 52.9 and well above expectations. Translation? The services sector is running hot, which pushes back against the idea that the economy is cooling.
ISM Non-Manufacturing PMI (July) – Tuesday
Another deep dive into the health of the services sector. If this shows signs of slowing, it could be the first crack in the “still-strong economy” narrative.
10-Year Treasury Auction – Wednesday
This is a big one for mortgage rates. If demand for Treasurys is weak, yields can jump—and so can rates. Strong demand could mean the opposite.
Initial Jobless Claims – Thursday
Think of this as the weekly temperature check on the job market. With last week’s soft jobs data still in the air, another uptick here would strengthen the case for a September rate cut.
Fed Speakers – All Week (5 events)
Five scheduled appearances from Fed officials, each offering their own take on inflation, growth, and rate cuts. Expect markets to parse every word—even if the big picture is already pointing toward a cut.
Earnings Season Marches On
About 20% of the S&P 500 reports this week. Company results may not seem connected to mortgage rates, but strong or weak earnings can send ripples through stocks, bonds, and investor sentiment.
Bottom line—every one of these moments has the potential to nudge rates and reshape real estate momentum. Right now, the winning combination for buyers would be softer labor data, easing inflation, and slower growth… all of which point toward rate relief as early as September.

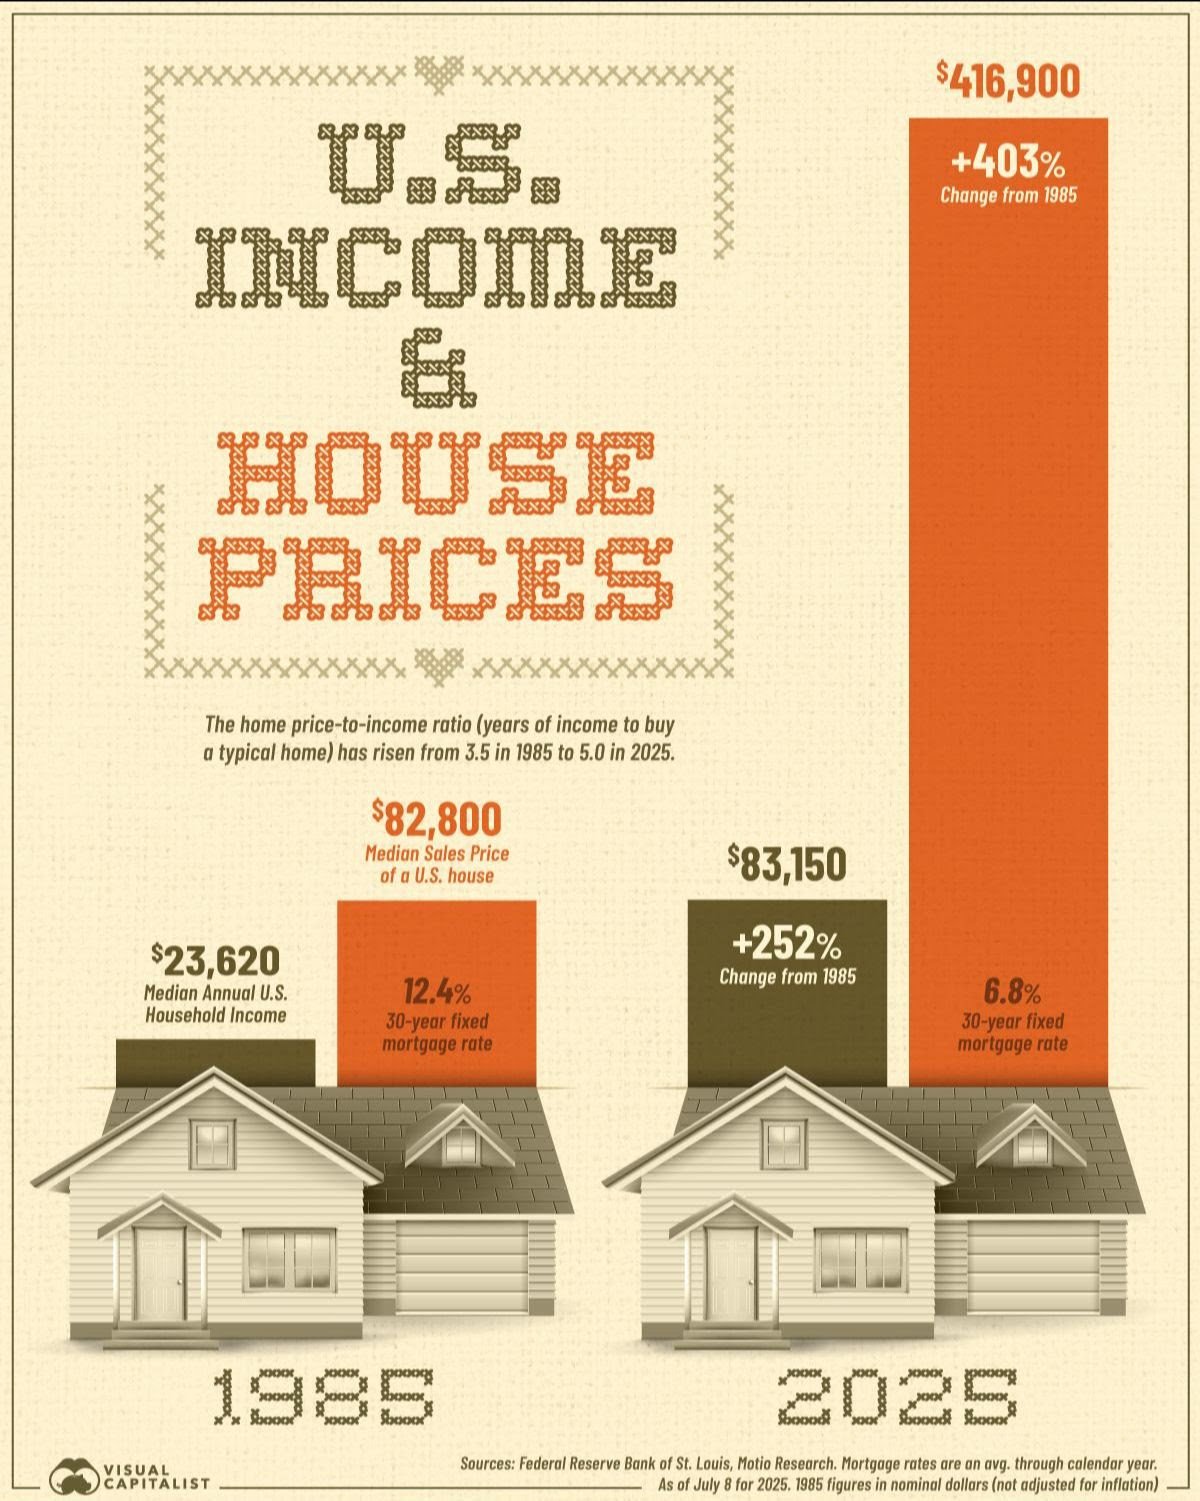
Something interesting is happening in the housing market: prices are starting to slip in some of the hottest metros. Redfin’s latest data, covering the four weeks ending July 27, 2025, shows that in 14 of the 50 largest U.S. metros, home prices actually fell year over year. Homes are sitting longer, negotiations are back on the table, and for buyers—this could be the opening you’ve been waiting for.
Here’s what’s standing out:
Oakland, CA leads the pack with a 6.8% drop in median prices—the sharpest decline among major metros.
Other notable declines: West Palm Beach (-4.9%), Jacksonville (-3.1%), Austin (-2.9%), and Houston (-2.8%).
Nationally, prices are still up 2% from last year, but that’s a sharp slowdown from the 5–6% gains we saw in late 2024 and early 2025.
Redfin economists now expect a 1% national price dip by the end of 2025.
The median asking price just hit its lowest point in five months, suggesting sellers are pricing more aggressively to attract offers.
Mortgage payments have eased to $2,671 a month, the lowest since January.
Pending home sales are down 1.4% year-over-year, while inventory is up 8.9%, tilting the market toward buyers.
New listings barely budged—just 0.6% higher than last year—as many sellers wait out softer demand.
Homes are now taking a median of 40 days to sell, and only 27.1% are closing above asking price.
We’re seeing the early signs of a market shift—especially in higher-cost metros where inventory is outpacing demand. For buyers, this is leverage. For sellers, it’s a reality check. The opportunities are there, but success in this market will come down to strategy, timing, and negotiation.

Every generation faces moments that feel like the world has tilted off its axis—stock market crashes, inflation spikes, wars, political upheaval. Yet time and again, history shows us something remarkable: the markets bend upward, real estate holds its ground, and tangible assets, when managed well, don’t just survive—they grow.
That’s not wishful thinking. It’s pattern recognition. And the pattern says this: the storms come, the storms pass, and the patient, disciplined investor wins.
Here’s how housing has responded through ten major crises:
Great Depression (1929–1939): Prices collapsed, then recovered as New Deal policies restored buyer credit and sparked construction.
World War II & Post-war Recession: Demand surged after the war, fueling a suburban housing boom.
1970s Inflation & Oil Shocks: Housing proved an inflation hedge—prices and rents climbed. Sound familiar?
Early 1980s Recession: Mortgage rates hit record highs, slowing sales—then demand roared back when rates eased.
1990s Savings & Loan Crisis: Some regions cooled temporarily, but demographic growth drove recovery.
Dot-Com Bust (2001): Tech-heavy markets softened, but diversified markets stayed steady.
Great Financial Crisis (2007–2009): The hardest housing hit in modern history—followed by a decade of historic gains for those who bought in early 2009.
Pandemic Shock (2020): Brief pause, then a nationwide surge in values as record-low rates and lifestyle shifts fueled demand.
Recent Inflation Surge (2021–2023): Prices rose despite rate hikes, defying predictions of a collapse.
Manufacturing & Policy Shifts (2025): Slower activity in some metros, but housing remains a hedge against uncertainty.
Now, while history gives us optimism, the present is sending warning signals:
Negative Job Revisions: July added just 73,000 jobs, and earlier months were revised down by 258,000. Full-time positions are disappearing.
Manufacturing Recession: PMI at 48.0—its lowest since 2024. A quarter of manufacturers cut jobs in July.
Inverted Yield Curve: Two-year yields still higher than ten-year—a recession signal flashing for over a year.
Consumer Softness: Home prices fell in 14 major metros; inventory is up, days on market are lengthening.
Corporate Strain: Small business hiring is slowing, bankruptcies ticking higher, earnings guidance turning cautious.
Are we in a technical recession? Not yet. But the slowdown signals are stacking up.
And here’s the point—whether we call it a recession or just a cooling cycle, the lesson doesn’t change: if you buy within your means, with a long-term plan, the short-term noise is just that—noise. Real estate is still one of the most resilient wealth-building tools in history. The data backs it up, the past confirms it, and those who act strategically in uncertain times are the ones who reap the rewards when the skies clear.

Buying a home feels like a dream — right up until that one thought hits:
“How am I ever going to come up with the down payment?”
Cue the doubt.
Cue the delay.
Cue the “maybe I’ll just keep renting.”
But what if the biggest thing standing between you and homeownership... was a myth?
Let’s walk through the truth behind three of the most common down payment beliefs — and why they might be holding you back more than they’re helping.
Myth #1: “I need a huge down payment.”
Most people think they need 10%, maybe even 20%, just to get in the game. The reality? First-time buyers often put down much less — between 6% and 9% on average.
FHA loans allow 3.5% down. VA loans? Sometimes nothing at all.
And conventional loans for first-time buyers? You can start with just 3%, without upfront mortgage insurance. The bar isn’t as high as it’s been made to seem.
Myth #2: “It’ll take me forever to save that much.”
Not if you’re clear about the target. If you’re saving for 3% to 5% — instead of the mythical 20% — that timeline shortens dramatically. Add a budget, adjust a few habits, and you might be surprised how fast things can shift.
Most people aren’t as far off as they think — they’re just aiming at the wrong number.
Myth #3: “I have to do it all myself.”
Nope. There are thousands of down payment assistance programs across the country. But here’s the wild part: almost 40% of buyers have no idea they exist.
We’re talking grants. Forgivable loans. Deferred payments.
This kind of help isn’t rare — it’s available right now, in almost every market.
“With high interest rates and soaring home prices, down payment assistance is more essential than ever.”
— Miki Adams, CBC Mortgage Agency
So here’s the takeaway:
You don’t need a mountain of cash.
You don’t need to go it alone.
And you’re probably a lot closer to buying than you think.
Let’s talk. I’ll help you map out a strategy, explore your options, and get crystal clear on what’s actually possible — not just what you’ve been told.
The goal? Homeownership that feels real. Not far away.

If you’ve been watching the debt markets over the past couple of years, you know the pace has felt… sluggish. Deals were harder to pencil. Lenders were cautious. Borrowers were holding their breath.
But 2025? The pulse is getting stronger.
The Numbers Are Telling a Different Story
Fresh data from Cred-iQ shows a notable rebound:
CMBS conduit issuance is expected to reach $35B — a 6.4% increase over last year.
CRE CLOs are surging, projected to hit $32.5B, up a staggering 274%.
Single-borrower large loans? On track for $90B, a 28% gain from 2024.
This isn’t just random growth — it’s targeted capital looking for the right opportunities.
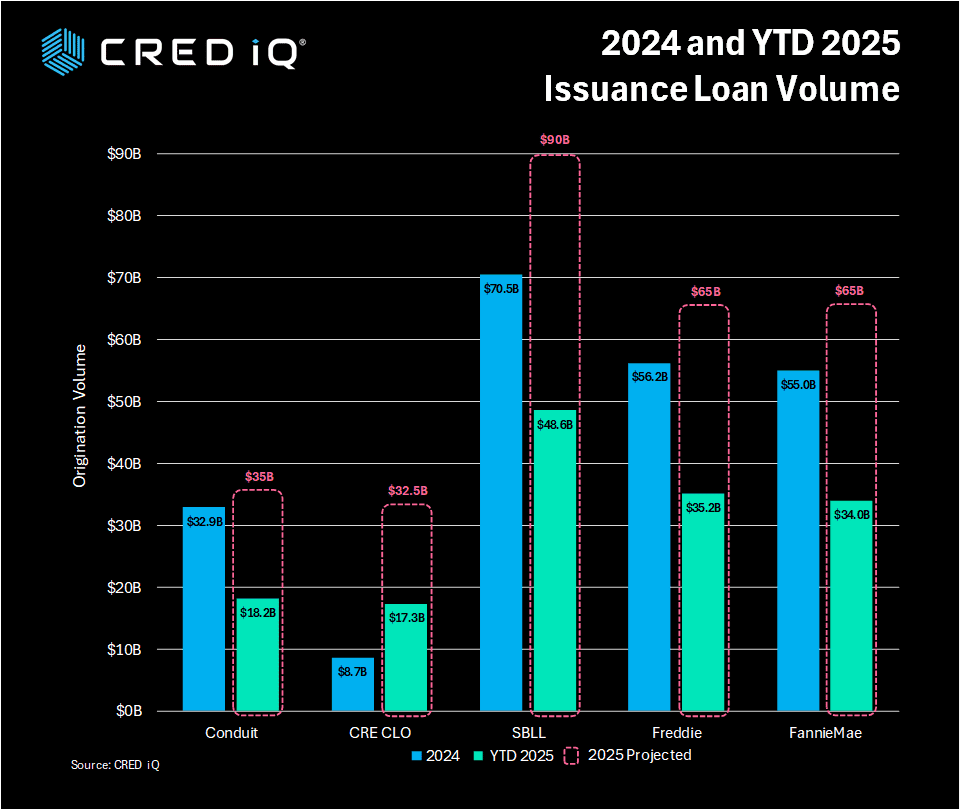
Agencies Are Back in the Game
Freddie Mac and Fannie Mae are each expected to originate $65B in loans by year-end — about 19% higher than last year.
Why? Multifamily demand is holding strong, and the lending environment has shaken off some of the post-slowdown hesitation.
Rates Show Where the Appetite Is
The cost of capital varies widely — and it tells you exactly where lenders feel the risk is:
Freddie Mac: 5.71%
Fannie Mae: 5.74%
CMBS conduit loans: 6.63%
CRE CLOs: 7.62%
Single-borrower large loans: 8.30%
Lower rates on agency debt signal stability. Higher yields on floating-rate and structured products? That’s lenders asking to be paid for taking on more uncertainty.
A Glimpse From the Inside
Blackstone’s COO, Jonathan Gray, recently pointed out that slowing construction and renewed interest in logistics and multifamily could be the early signs of recovery. And with the Fed starting to ease rates, the lending climate is thawing faster than many expected.
The Bottom Line:
Capital is moving again. Deals are happening. But underwriting hasn’t loosened — it’s just more willing to engage when the fundamentals are right.
In other words: the money is there, but it’s still picky about where it goes.